 Reports – Admin
The Reports tab for Admin and those with Reports View permission include various dashboards with quick snapshot information as well as other reports that can be filtered to see specific data. Some reports will allow specific data points to be expanded or drilled down for more detail. To view the reports, choose “Reports” from the left-side “Main Menu.”
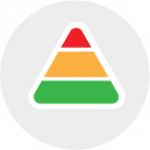
Favorites:
- Daily Referrals – displays the total number of major and minor referrals currently recorded today.
- My Favorites – allows you to favorite various reports, by selecting the orange star in the top right corner of the report, so that they can be quickly accessed here.
- Change Order – allows you to rearrange the favorited reports to make your frequently used reports easily accessible.
- Daily Points by Grade – displays the number of points being given by each grade today.
- Group Point Leaders – shows the group point leaders in your school.
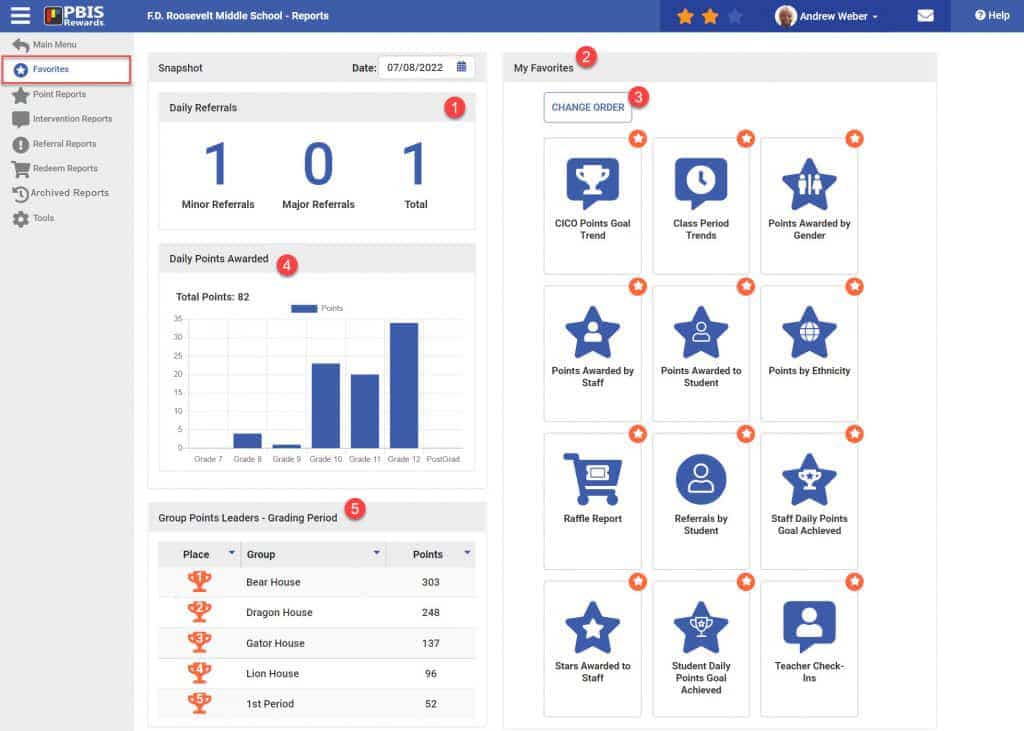
Points Reports:
- Total Daily Points Awarded – shows how many points have been awarded today and yesterday. If your school awards points using the 1-10 option, use the details button to find all the points that have been awarded to the students in any favorited group.
- Today’s Points by Expectation – show how many points have been awarded per school-wide expectation and use the details to find all the points that have been awarded to the students in any favorited group.
- User Guide – takes you to the user guide page on the support site that has more detailed information about the points reports.
- Staff Daily Points Goal Achieved – displays how many staff members have reached their daily point goal, not reached the goal or not awarded any points today.
- Student Daily Point Goal Achieved – displays how many students have reached their daily point goal, not reached the goal or not earned any points today.
- Points By Month – shows how many points have been awarded each month.
- Additional Reports Available:
- Awarded By Staff – show points awarded by a staff member or by all staff members with totals. View the data for today, the previous day, the current grading period, year-to-date, or a custom date range.
- Awarded to Students – you may view points awarded to students individually, by a favorited group, grade level or all students with totals. Select a timeframe for the data using today, the previous day, current grading period, year-to-date, or a custom date range. Points are broken down by expectation, if applicable.
- Stars Awarded to Staff – shows the number of stars the staff have been awarded.
- Points Awarded by Grade – shows the points awarded to students based on grade.
- Average Points Awarded by Staff – provides an average of the points staff members give in each action across the requested time frame
- Points Awarded by Group – allows you to compare point and expectation totals between your favorited groups. Only the points awarded to these students directly using this group by the signed in user are included. (To see all point data for groups, select Details on the Today’s Points by Expectation report)
- Points vs. Referrals – compares the rate of referrals and rewarding points per month.
- Points Awarded by Gender – shows the average points awarded to students based on gender.
- Points Awarded by Ethnicity – shows the average points awarded to students based on ethnicity.
- Points by House – shows points awarded to the house avatar, students in the house, or both.
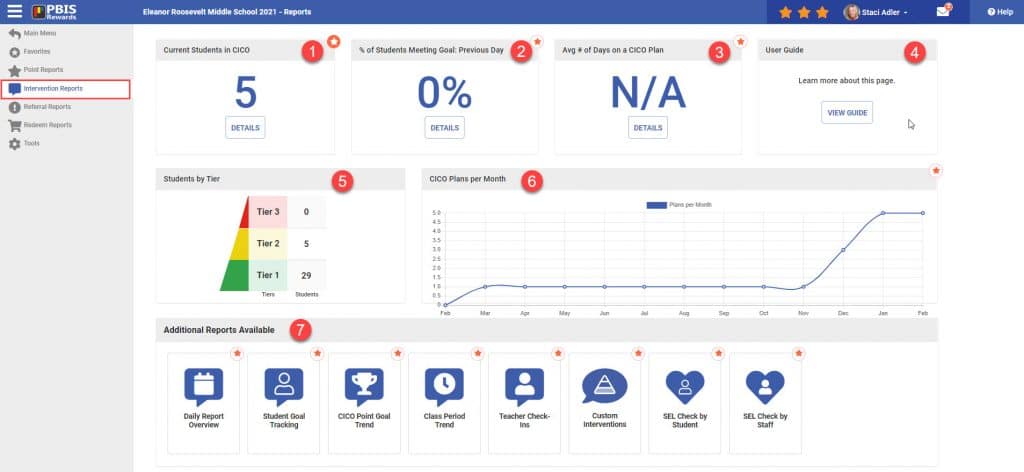
Intervention Reports (CICO):
- Current Students in CICO – displays the number of students that currently have an active CICO plan.
- % of Students Meeting Goal: Previous Day – shows the percentage of students, on an active CICO plan, that have met their point goal the previous day.
- Average # of Day on a CICO Plan – calculates the average number of days a student is on a CICO plan.
- User Guide – takes you to the user guide page on the support site that has more detailed information about the intervention reports.
- CICO Plans per Tier – illustrates the number of students that are in Tier 2 (CICO) and the number of students in Tier 1 PBIS Rewards (total number of students).
- CICO Plans per Month – tracks the number of active plans per month.
- Additional Reports Available:
- Daily Report Overview – mirrors the “Daily Report” tab on the CICO Coach tab of the main menu.
- Student Goal Tracking – shows student progress the with different goals that they are working on in their CICO plan.
- CICO Point Goal Trend – highlights student progress with their daily CICO point goal.
- Class Period Trend – tracks the point totals in the different class periods that the student is being checked-in.
- Teacher Check-Ins – shows the average number of points teachers are awarding students on their CICO plan.
- Custom Interventions – show the number custom interventions logged in the student dashboards.
- SEL Check by Student – provides information on the SEL checks recorded for students including students with the highest risk checks and longest time since last check.
- SEL Check by Staff – displays the percentage of SEL checks for each status and shows the total number of checks given in each status by staff.
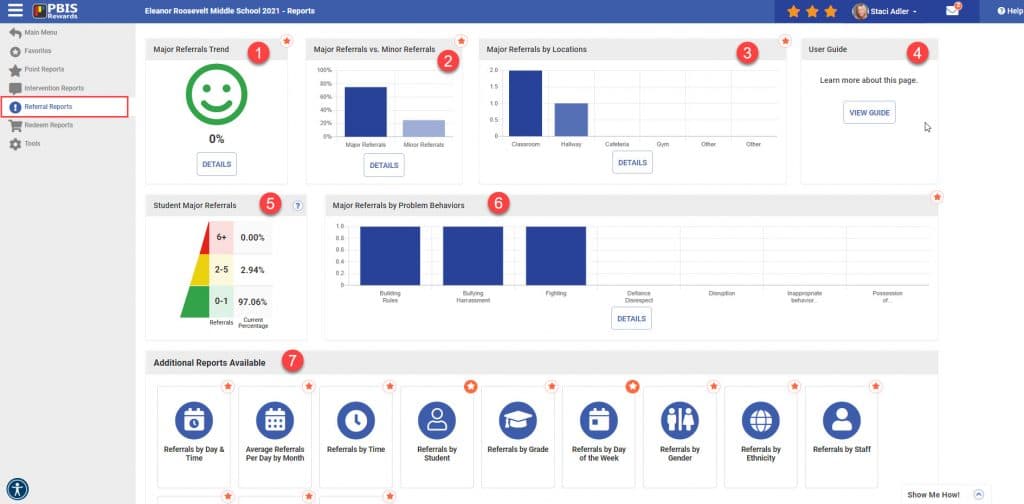
Referral Reports:
Note: The names of these reports may appear differently depending on how you have labeled your Major and Minor referrals in your ARS Customization tab of the Settings Menu
- Major Trend – displays an emoji that changes depending on if your number of referrals has gone up or down compared to yesterday.
- Major vs. Minor – compares the number of major referrals vs. minor referrals.
- Major by Location – shows where major referrals are taking place on your campus.
- User Guide – takes you to the user guide page on the support site that has more detailed information about the referral reports.
- Student Majors – illustrates the number of students in each Tier of the behavior MTSS pyramid.
- Majors by Problem Behavior – highlights the problem behaviors that are being identified when major referrals are issued.
- Additional Reports Available:
- Referrals by Day and Time – helps pinpoint the day and time when referrals are being issued in your building.
- Average Referrals Per Day by Month – calculates the daily average of referrals issued during each month.
- Referrals by Time – shows the time of day that referrals are occurring.
- Referrals by Student – allows you to search for referrals issued to a student individually, by a favorited group, grade or all students. This report also has the option to choose a student “Watch List Summary” that allows you to see the students with the highest number of referrals.
- Referrals by Grade – displays the number of referrals based on grade.
- Referrals by Day of the Week – gives the day of the week in which referrals have been issued.
- Referrals by Gender – shows the referral data based on gender.
- Referrals by Ethnicity – shows the referral data based on ethnicity.
- Referrals by Staff – allows you to search for referrals issued by a staff member base on a given time frame. This report also has the option to choose a staff “Watch List Summary” that allows you to see the staff that have issued the highest number of referrals.
- Referrals by Minor Problem Behaviors – highlights the problem behaviors that are being identified when minor referrals are issued.
- Suspensions by Grade – tracks the number of in-school and out-of-school suspension days issued based on grade.
- Suspensions by Major Problem Behavior – tracks the number of in-school and out-of-school suspension days issued based on the problem behavior identified.
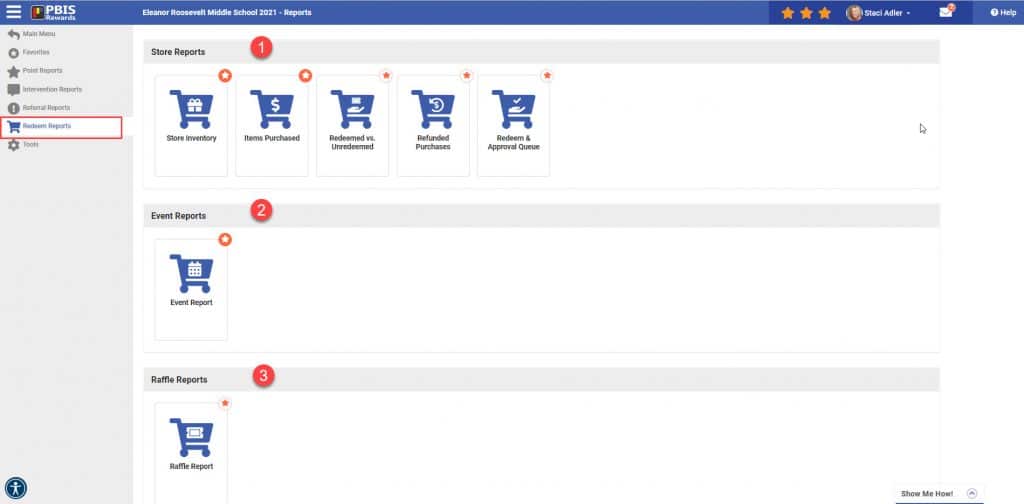
Redeem Reports
1. Store Reports:
- Store Inventory – Select to view store inventory for All Stores, School Store, or Select Teacher Store and then select Update. The number of times an items has been sold can also be found in this report.
- Items Purchased – Search for purchases individually or filter by a favorited group, grade level, or all students to view items purchased. Select a time frame from today, the previous day, current grading period, year-to-date or a custom date range. Select the Store or Stores.
- Redeemed vs Unredeemed – Items that were purchased as “redeem later” that have now been redeemed or not yet redeemed. Select a time frame from today, the previous day, current grading period, year-to-date, or custom date range.
- Refunded Purchases – Review refunds for Student, Favorite Groups, Grade or All Students. Select a time frame from today, current grading period, or year-to-date. Leave as default Store and Events, Store Only, or Events Only. Select Update to create the report.
- Redeem & Approval Queue – Items that are waiting to be redeemed and items that have been purchased by students that need to be approved.
2. Event Report – displays all of the events that have been created at your school and can be filtered by school events, teacher events or all events.
3. Raffle Reports – displays all of the raffles that have been created at your school and can be filtered by school raffles, teacher raffles or all raffles.
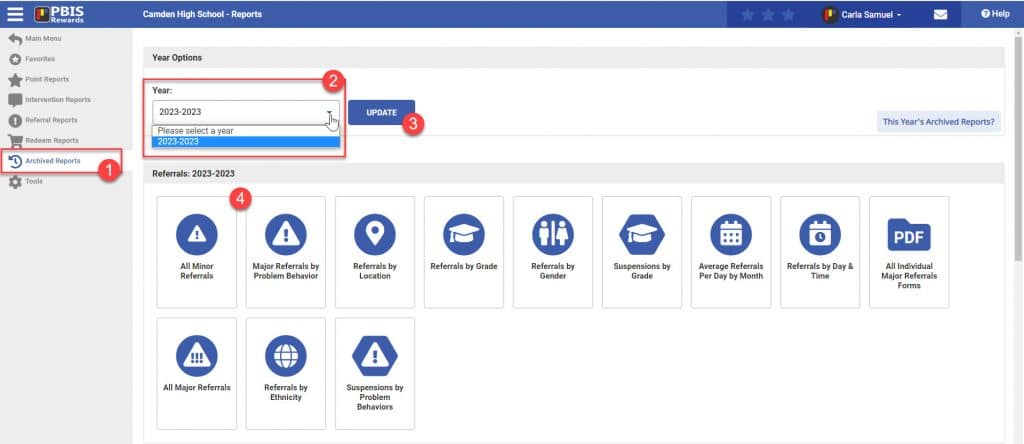
Archived Reports
- Select the “Archived Reports” tab on the reports page.
- Choose the appropriate year from the drop-down menu.
- Press the “Update’ button.
- The data collected in that school year will now be made available.
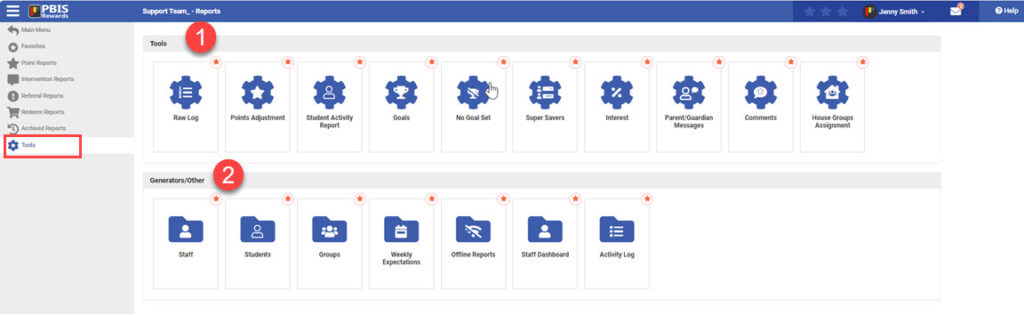
Tools
1. Tools:
- Raw Log – List all activity that has taken place in the mobile application and/or the desktop portal on any given date.
- Points Adjustments – The Points Adjustments report allows you to see if any adjustments have been made to student accounts. Select a time frame using today, current grading period, year-to-date, or a custom date range.
- Student Activity Report – Shows all point activity ledger for an individual student.
- Goals – Search for a student to see their progress or completion of store item goal.
- No Goal Set – Lists students who have not set a store item goal, along with their points balance.
- SuperSavers – Lists the top 10% of students with the highest balances.
- Interest – If Interest is turned on, this report will show what the students have earned. Select a time frame using today, current grading period, year-to-date, or a custom date range. Filter for a particular student, favorited groups, or all students.
- Parent/Guardian Messages– Allows you to see all of the communication between parents and staff members.
- Comments – Lets you see any comments that have been made to students when points were awarded.
- House Groups Assignments – Find which students are assigned to each house. You can select to view unassigned students and then use “assign” to randomly assign students to houses.
2. Report Generators and Other Reports:
- Staff Report Generator – Generate reports based on categories: number of scans, points awarded, average points awarded, and number of referrals.
- Student Report Generator – Create various, customized reports regarding students. The default report lists students’ balances and grading period balances.
- Groups Report Generator – Create reports about Group points or referral totals.
- Weekly Expectations – The Weekly Expectations reports will show you the points earned during a 7-day period.
- Offline Reports – Some reports could contain a large amount of data that could overload your browser. We will run those reports for you directly from the server, and send you an email when they are ready. You will visit this section of the reports page to download those reports as CSV files. Offline reports will be automatically deleted after one month, but you can delete them at any time after you have downloaded them or no longer need them.
- Staff Dashboard – Admins can create reports using all staff information.
- Activity Log – Log of admin edits in PBIS Rewards.